A Simple Scatterplot using SPSS
A simple scatterplot can be used to :-
(a) determine whether a relationship is linear(b) detect outliers(c) graphically present a relationship
A scatterplot is a very useful tool and makes us easily understand the relationship among the two components of our research study. Here let us take an example to illustrate and create a scatterplot using SPSS.
Example:-
A salesman for a large car brand wants to determine whether there is a relationship between an individual's income and the price they pay for a car. The salesman will use this information to determine which cars to offer potential customers in new areas where average income is known. Therefore, the dependent (outcome) variable is price, and the independent (predictor) variable is income.
The 7 steps that follow show you how to create a simple scatterplot in SPSS using the example above:-
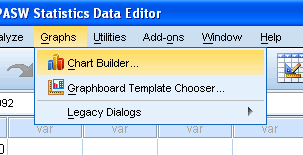
1) Click Graphs > Chart Builder... on the top menu as shown below:
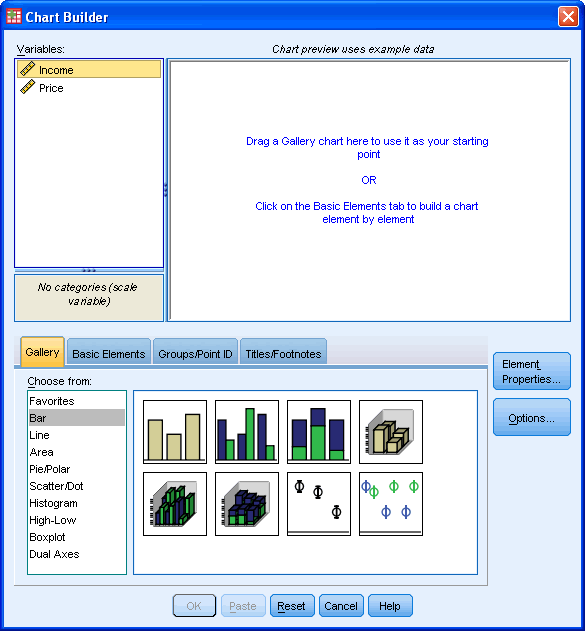
2) You will be presented with the following screen:
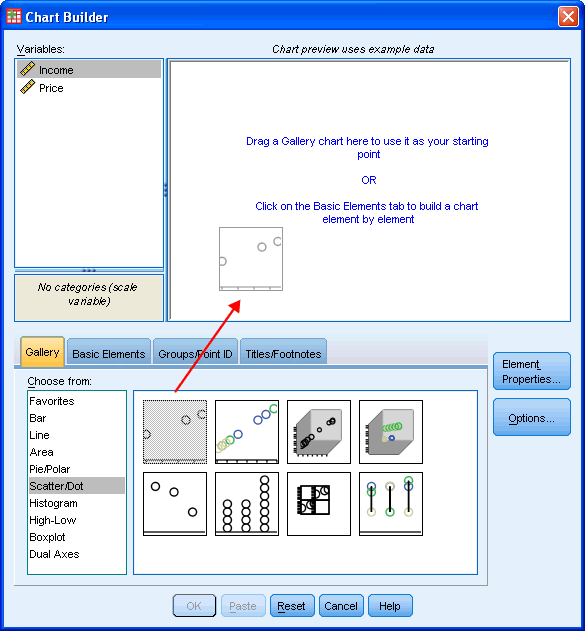
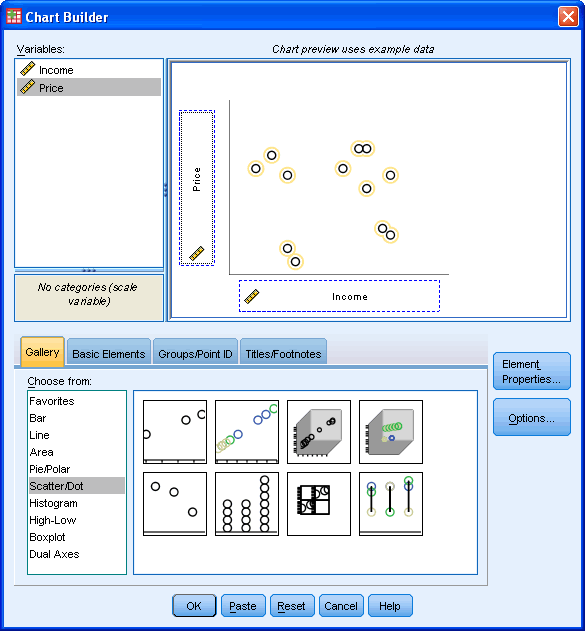
3) Under the Gallery Tab, select the Scatter/Dot option and the simple scatterplot icon (top-left icon). Drag-and-drop this icon into the Chart Preview Area.
4) You will be presented with the following dialog boxes: Chart Builder and Element Properties. As you can see, the Chart Preview Area has been populated with a template of a simple scatterplot.
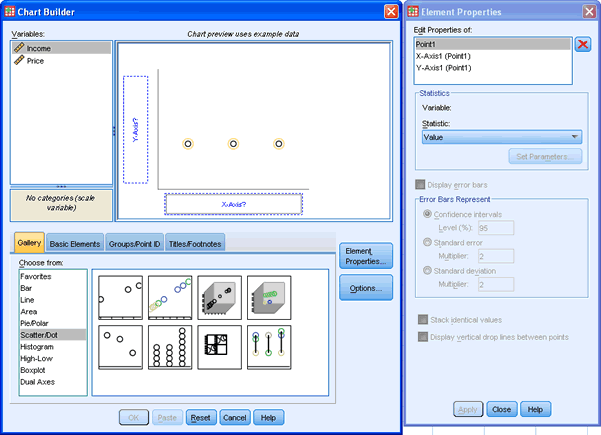
5) Transfer the independent (predictor) variable, income, into the "X-Axis?" box, and the dependent (outcome) variable, price, into the "Y-Axis?" box within the Preview Chart Area by drag-and-dropping the variables from the Variable: box.
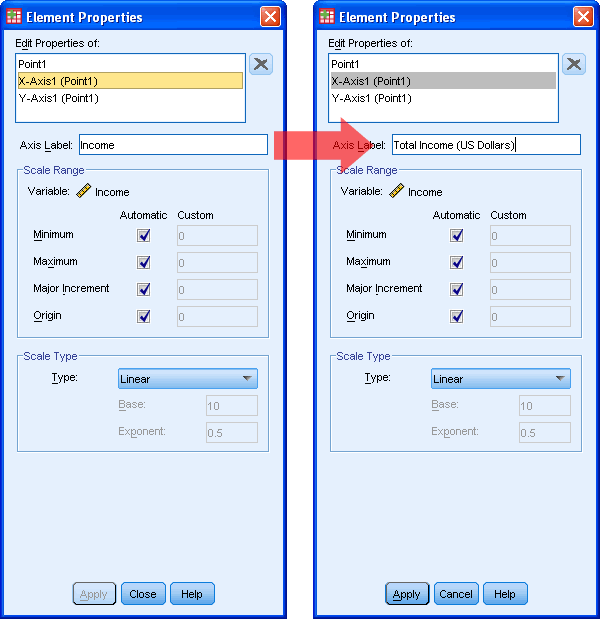
6) If you wish to change the axis labels, select "X-Axis1 (Point1)" and/or "Y-Axis1 (Point1)" in the Element Properties dialog box and type in the new axis title. Below we demonstrate changing the X-Axis label from "Income" to "Total Income (US Dollars)". Remember to click the apply button after each label change. Repeat with the Y-Axis by changing the label from "Price" to "Car Purchase Price (US Dollars)", and again, click the apply button.
7) Click the OK button.
So, it could be very clearly observed that how by creating a simple scatterplot we can find out the fluctuations in relationships among the components in our study. In any kind of marketing research and analysis, scatterplot comes across as a very useful tool.